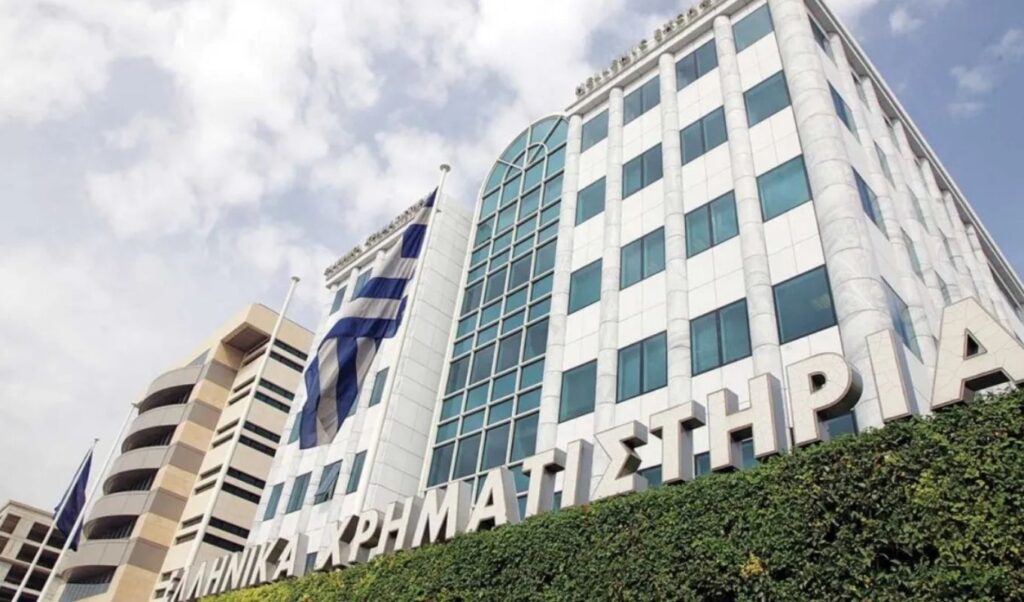
The stock market is on course, barring any dramatic change in conditions, for its sixth consecutive year of positive returns, trading at 17-year highs. From the end of 2020 through today, the main stock market index has recorded gains of 229%. The biggest challenge this year, in terms of returns, is potentially matching the six-year streak of 1985–1990 — a bull run that has never been repeated in the modern history of the Athens Stock Exchange.
Over the past five-plus positive years, the Greek stock market has ranked in the top 5 globally and for certain periods has held the number one position in the world rankings.
The market’s support over the past five years has come from high growth rates — significantly higher than the Eurozone average — strong fiscal performance, political stability, solid results from listed companies, the return of banks to normality, and market expectations for the recovery of investment-grade status — expectations that were ultimately fulfilled.
Additional tailwinds include the high profitability of listed companies, generous dividends, the integration of the Athens Stock Exchange into Euronext, and the upcoming reclassification of the Athens Stock Exchange to developed market status.
Since the end of 2020, when the market’s upward trajectory began, the main stock index has recorded total gains of 229% (based on the closing price of Thursday, 27 August 2026).
Total market capitalisation has increased by approximately €140 billion over the past five-and-a-half years, reaching €192 billion, up from €53 billion at the end of 2020.
The banking index has outperformed significantly over the same period, with gains of 498%. The large-cap index has risen 252%, while the mid-cap index has gained 180%.
Average daily trading volume now stands at close to €344 million — the highest level since 2008 — representing a significant increase compared to 2025, when average daily trading volume was approximately €210 million. In 2024, it stood at €140.2 million, versus €111 million in 2023. In 2022, the figure was €74 million, while average daily turnover in 2021 was €70.8 million and €64.5 million in 2020.
Five-year performance breakdown
Since the end of 2020, the biggest gains have been recorded by Moda Bango (+1,926%), Cenergy (+1,223%), and Ekter (+713.85%). By contrast, the steepest declines were posted by Andromeda (-62%), Prodea (-60%), and Iktinos (-56%).
Among large-cap stocks, the top performers were: Aktor (+797%), Eurobank (+692%), National Bank of Greece (+642%), Alpha Bank (+374%), GEK TERNA (+498%), Motor Oil (+417%), Viohalco (+355%), Titan (+287%), PPC (+217%), ELPE (+180%), and Aegean Airlines (+162%). These are followed by Elvalhalcor (+121%), OLP (+105%), Coca-Cola HBC (+101%), Jumbo (+82%), EYDAP (+78%), Optima (+64%), OTE (+49%), Allwyn (+38%), and CrediaBank (+3.70%). The only large-cap stock in negative territory is Lamda Development (-9.15%).
Year-by-year performance of the Athens Stock Exchange
2021
The stock market closed 2021 with gains of 10.43%, nearly recovering the ground lost in 2020 (-11.75%). Total market capitalisation increased by €12.227 billion to reach €66.092 billion, following a decrease of €7.8 billion in 2020.
Listed companies raised €7.9 billion from the Athens Stock Exchange in 2021 through capital increases and corporate bond issuances.
Despite pressure from the pandemic and a sluggish start to the year, listed companies achieved a full recovery in profits and business activity.
The banking index posted annual gains of 10.78%, following losses of 41.37% in 2020, as banks showed signs of returning to normality with a reduction in non-performing loans.
2022
The Athens Stock Exchange went against the bears in 2022, managing in a challenging environment to resist the war in Ukraine, global inflation, rising interest rates, and the energy crisis — differentiating itself positively from other developed markets worldwide, something that had not happened since 1990.
The Greek stock market not only mounted a strong defence, outperforming international markets in a difficult global environment, but ultimately closed in positive territory with an annual gain of 4.08%, while major international indices fell sharply (S&P -19%, Nasdaq -33%, Dow Jones -9%, DAX-30 -12%).
The Greek stock market found its support primarily in the high growth rates of the Greek economy, record results posted by listed companies, and the return of the banks. After many years, banks were profitable once again, with single-digit NPE ratios.
The banking index recorded annual gains of 11.42%. In 2022, listed companies raised a total of €1.094 billion.
2023
The Athens Stock Exchange closed 2023 with impressive gains of 39.08%, completing its third consecutive year of growth and ranking at the top of global performance tables. It claimed the “bronze medal” globally, finishing behind Russia’s MOEX index and the Nasdaq.
Total market capitalisation increased by €22.026 billion, reaching €87.888 billion.
In 2023, listed companies raised a total of €2.044 billion through the stock exchange.
The significant rise in share prices was accompanied by an increase in trading volumes, with average daily transactions reaching €111 million — nearly 50% higher than the previous year. The banking index rose 65.73%, while the total market capitalisation of the four systemic banks increased by €7.889 billion.
2024
The Athens Stock Exchange closed 2024 with gains of 13.65%. Average daily trading volume rose by 26%, reaching approximately €140.2 million.
Total market capitalisation increased by €15.257 billion, reaching €103.145 billion.
If there is one area in which the Greek market excelled in 2024, it was its improved ability to attract capital through share offerings from major shareholders and initial public offerings.
The total volume of public share offerings and block placements by major shareholders exceeded €3.7 billion, while mergers and acquisitions involving listed companies on the Athens Stock Exchange directly or indirectly exceeded €10 billion in enterprise value.
In 2024, there was a clear increase in equity issuances in Greece, including the first major IPO in many years, the continuation of successful bank divestments, and several other offerings.
The IPO of Athens International Airport “Eleftherios Venizelos” (an offering of €785 million — the 4th largest in the history of the Athens Stock Exchange, with 12x oversubscription) and two block placements in Piraeus Bank and National Bank of Greece were at the centre of attention.
Notably, demand for the two bank placements exceeded €20 billion, with only €2 billion ultimately allocated. In total, the market raised approximately €3.3 billion from the above offerings, which attracted over €30 billion in demand.
2025
The year 2025 was a landmark year for the Athens Stock Exchange, marked by exceptional economic performance and strong market momentum. A painful market cycle came to a close in 2025, with the stock market returning to pre-crisis levels last seen in 2010 and closing near 16-year highs. The gains were supported by robust economic growth, fiscal stability, and growing investor confidence, placing Greece among the best-performing equity markets in the world in 2025.
The defining market event of the year was the acquisition of majority control of ATHEX Group by Euronext.
The General Price Index’s annual gain of 44.30% in 2025 was the largest since 1998 (+102.2%).
The Greek stock market ranked sixth globally among stock markets, behind the exchanges of Seoul, Tel Aviv, Vietnam, Madrid, and Vienna.
Total market capitalisation reached levels not seen since September 2008. Overall capitalisation increased by €43.108 billion in 2025, reaching €146.253 billion.
Average daily trading activity surged to levels not recorded since 2009. Average daily trading volume exceeded €200 million for the first time since 2009, reaching €210 million in 2025.
ANNUAL PERFORMANCE OF THE GENERAL INDEX
2025 +44.30%
2024 +13.65%
2023 +39.08%
2022 +4.08%
2021 +10.43%
2020 -11.75%
2019 +49.47%
2018 -24.74%
2017 +24.66%
2016 +1.95%
2015 -23.58%
2014 -28.94%
2013 +28.06%
2012 +33.43%
2011 -51.88%
2010 -35.62%
2009 +22.93%
2007 +17.86%
2006 +19.93%
2004 +31.5%
2003 +23.10%
2002 +29.5%
2001 -32.5%
2000 -23.5%
1999 -38.8%
1998 +102.2%
1997 +85.1%
1996 +58.5%
1995 +2.1%