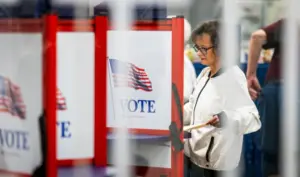
Donald Trump is attempting to reverse the negative tradition deeply embedded in the American presidency — the midterm elections that reshape the balance of power in Congress at the halfway point of a presidential term — even though all indicators appear to be working against him. A look at history reveals just how daunting this challenge is, and it’s worth noting that 57 million voters have already cast their ballots early.
As an Al Jazeera analysis summarizing the data reminds us, in 18 out of 20 midterm elections held between 1946 and 2022, voters stripped seats in the House of Representatives from the party occupying the White House. The average loss was 26 seats, according to the same analysis. Only Bill Clinton’s Democrats in 1998 and George W. Bush’s Republicans in 2002 managed to buck that trend.
Read also: Trump attacks Democrats ahead of US midterm elections: “Their candidates are extreme, dangerous — and pro-jihadist” (Video)
US midterm elections: 18/20 losses for the president’s party, with 7 House flips
The chart below shows how many House of Representatives seats the president’s party has gained or lost in every midterm election since 1946, from Harry S. Truman to Joe Biden.
Democratic presidents have suffered the largest midterm losses since 1946. On average, their party has lost approximately 29 House seats in midterm elections, compared to roughly 23 under Republican presidents, according to the data.
The biggest loss came in 2010, two years after Barack Obama became the first African American elected president, when Democrats lost 64 House seats and Republicans seized control of the chamber. Democrats under Truman lost 56 seats in 1946, while under Clinton they lost 54 in 1994 — each time surrendering control of the House of Representatives.
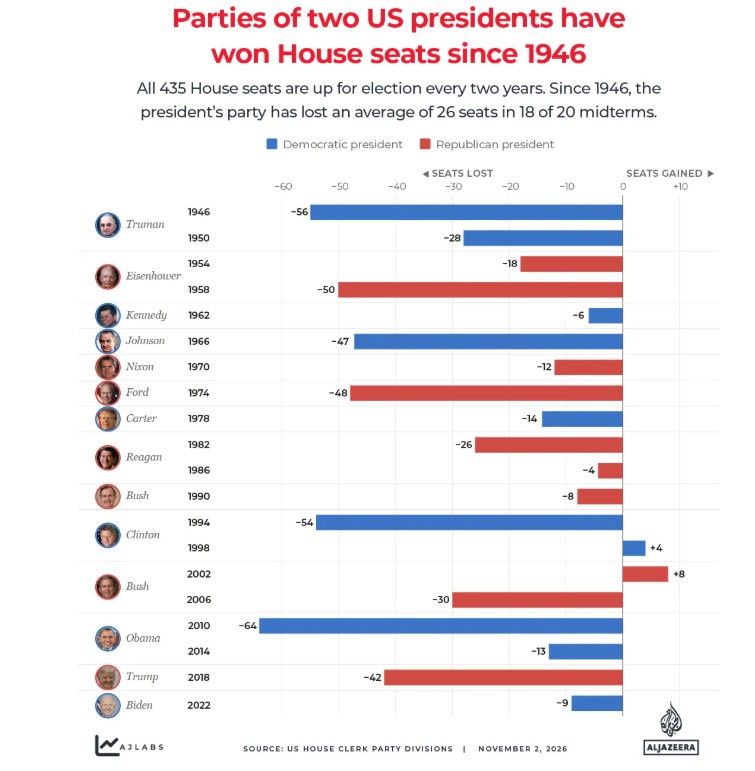
The worst Republican losses came under Dwight D. Eisenhower, when the party lost 50 seats in 1958, and under Gerald Ford, when it lost 48 in 1974. Donald Trump’s first midterm elections in 2018 cost Republicans 42 seats and control of the House of Representatives.
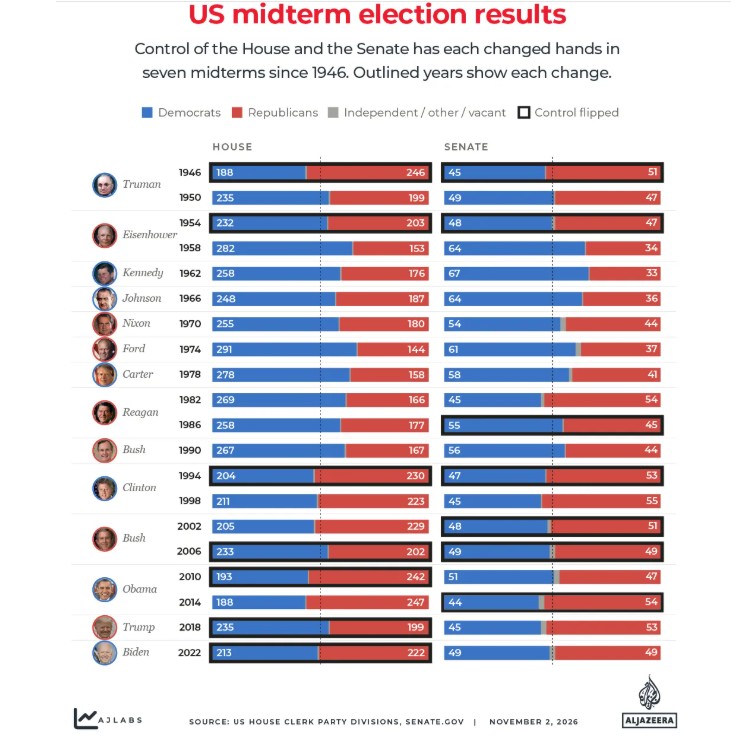
Large losses frequently cost the president’s party its majority. In seven of the 20 midterm elections since 1946 — in 1946, 1954, 1994, 2006, 2010, 2018, and 2022 — the House of Representatives changed hands.
Midterm elections: 13/20 losses for the president’s party in the Senate
The president’s party has lost Senate seats in 13 of the 20 midterm elections held since 1946, but lost control of the Senate in only six of them: 1946, 1954, 1986, 1994, 2006, and 2014.
Unlike the House of Representatives, where all seats are up for election every two years, only about one-third of the Senate’s 100 seats are contested in each election cycle, as senators serve six-year terms and elections are staggered. This means which states are voting can matter just as much as the national political climate.
Eisenhower’s Republicans suffered the worst Senate defeat of the period, losing 13 seats in 1958. Truman’s Democrats lost 12 in 1946, while Obama’s Democrats lost nine in 2014 — handing Senate control to the Republicans.
At times, the two chambers have moved in opposite directions. In 1982, Ronald Reagan’s Republicans lost 26 House seats but gained one in the Senate. In 2018, Trump’s Republicans lost the House but added one Senate seat, while in 2022, Biden’s Democrats lost the House yet gained one Senate seat.
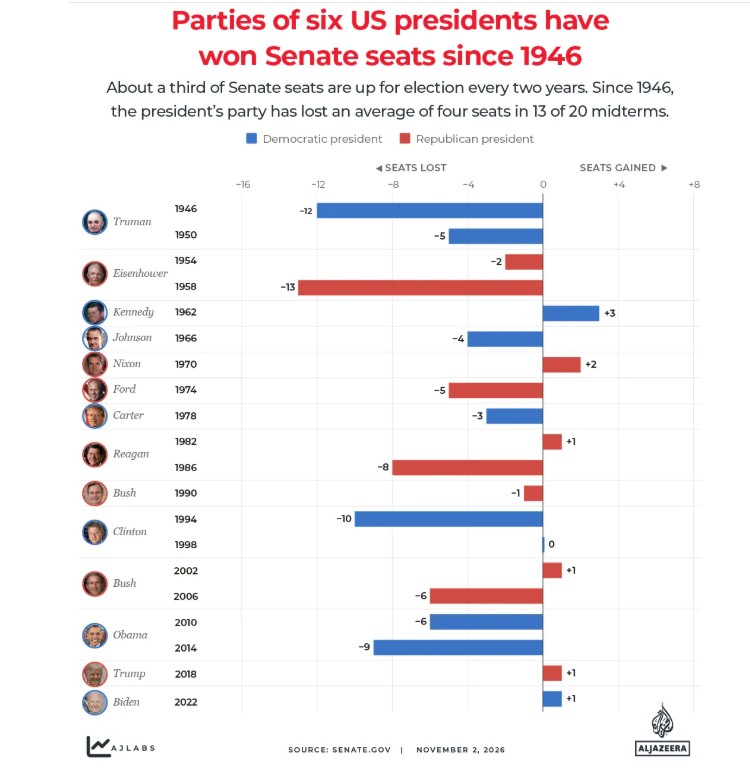
These patterns demonstrate that trends in the two legislative chambers don’t necessarily move in lockstep with the broader electoral backlash against the sitting president. A party can, for example, hold its ground in a favorable Senate map while simultaneously losing competitive House districts.
The chart below presents the outcome of each midterm election alongside the resulting shift in the balance of power.
What the betting markets are showing
As for the current election, prediction markets indicate that both chambers of Congress could flip to the Democrats. The House of Representatives appears to be all but locked in for a Democratic majority, while the odds of a similar outcome in the Senate are also running very strong.
The leading prediction market platforms, Kalshi and Polymarket, are currently estimating the following (note: percentages shift dynamically):
Kalshi: Senate — 75% probability of a Democratic majority with a 53-46 seat split; House of Representatives — 94% probability of flipping to the Democrats, with a projected 234-188 seat count.
Polymarket: Senate — 77% probability of going blue (i.e., a Democratic majority); House of Representatives — 96% probability of changing hands and coming under Democratic control.