The increase in the percentage of those refusing to declare voting intentions undermines the predictive capability of polling tools and leaves a significant portion of the electorate unclear, currently fluctuating around 16%-17% in recent measurements. Regardless, voting intention is not a fixed measure, but rather a potential recording of electoral behavior that can change based on political, social and economic developments. In political theory, we recognize some basic parameters, such as ideological and party identification. However, the decline of political divisions and ideological identities weakens the significance of these criteria, which are replaced by so-called issue voting, including a series of independent variables that interact and influence the final choice.
What we will attempt in our analysis is first to map the demographic profile of undecided voters and then chart specific parameters that reveal the proximity or distance of this segment of the electorate regarding basic political choices.
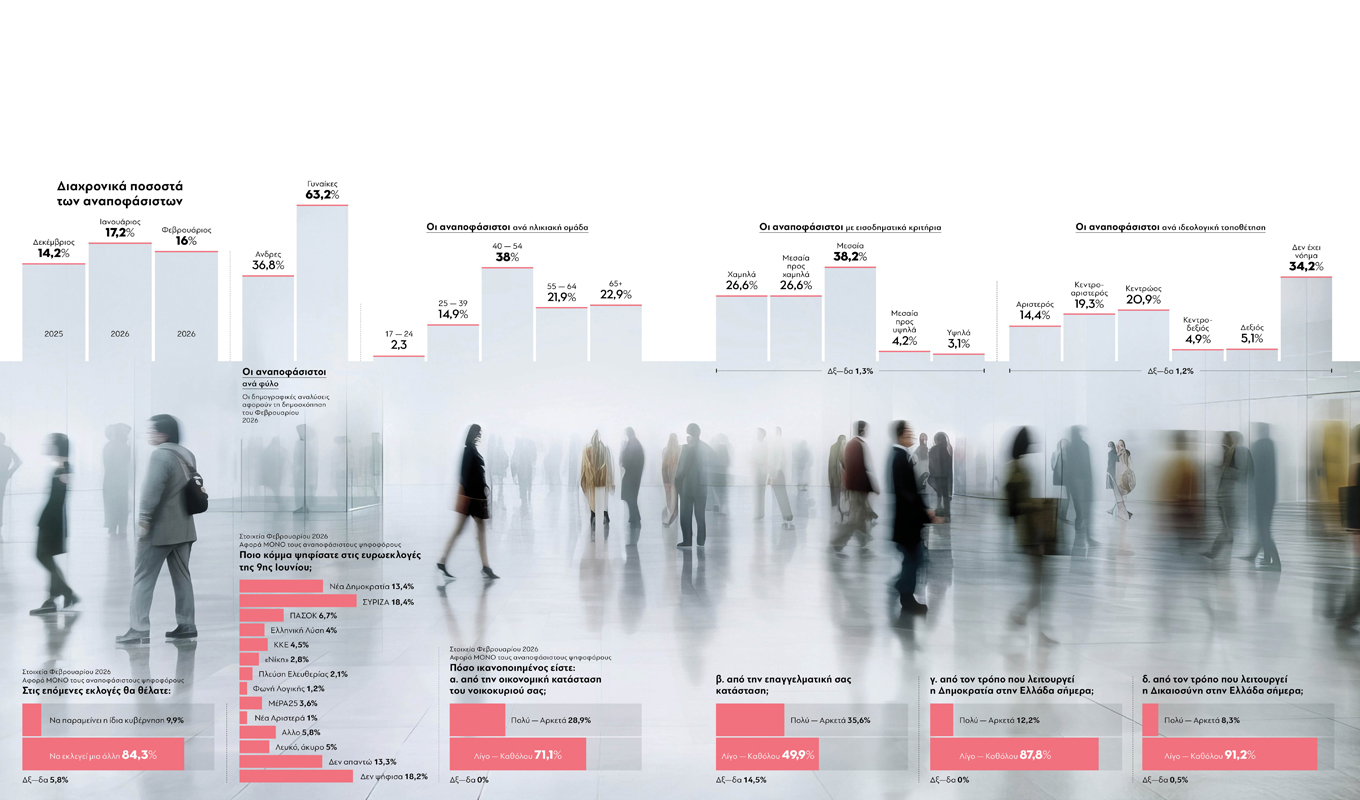
The demographic profile of undecided voters
Initially, we observe in the tables that the percentage of undecided voters is almost double among women, as of the 16% of the total that remains unclear, 63.2% are women and 36.8% are men. The degree of involvement and identification of women with active party representatives is clearly lower, making the female audience more volatile and less devoted to previous political behaviors, which they tend not to repeat to the degree that male voters do. Women’s voting is significantly determined by the themes of the public agenda, making it more rationalistic and less connected to political traditions.
The age group facing the greatest economic pressure
The second demographic factor relates to age, where the middle age group of 40-54 years accounts for the largest percentage within the 16% of undecided voters, at 38%. This is the age category that clearly faces the greatest economic pressure from the high cost of living that has affected family budgets, at least over the past three years. The third factor is the respondent’s economic situation, where we find that the largest percentage of undecided voters comes from middle incomes.
Which party axis contains the largest percentage of undecided voters
Regarding ideological and party criteria, we observe, confirming what was mentioned above, that the largest percentage of undecided voters positions itself on the Left-Right axis, at 34.2%, in the position that this distinction “makes no sense,” clearly highlighting the decline of ideological identities.
Among those who continue to self-position on the traditional scale, we see that the largest concentration is recorded among center-left and centrist voters, while in relation to the last party choice in the 2024 European elections, we see that 18.4% of today’s undecided voters had voted for SYRIZA, 18.2% had not voted at all, and 13.4% had chosen New Democracy. In analyzing the question about what they would like the result of the next electoral contest to be, while 29.8% of the total sample answers that they would like the same government to remain, the corresponding percentage expressing the same desire among the undecided drops significantly to 9.9%, while the percentage of those wanting some other government to be elected increases to 84.3%. Additionally, on indicators concerning the degree of satisfaction with household economic status, professional prospects, and how democracy and justice function in Greece, undecided voters show lower satisfaction compared to the total examined sample. The above comparative secondary data are not static and will undergo changes up until election day. However, they describe the broader polling picture, which includes the government’s difficulty in extending its electoral influence to percentages beyond the recent European elections and the simultaneous inability of the opposition to capitalize on governmental wear and become an alternative power center.
Published in Parapolitika